Loading a sample profile…
EveryPlay. EveryPlayer. EveryAdvantage.
- 226,273 playscharted this season, every one matched to the official play-by-play.
- OffenseRun and pass by down, distance and field zone. Third down, red zone, two-minute.
- DefenseFronts, coverages and where drives stall, with the plays behind every count.
- Special teamsEvery kick, punt and return charted. Hang and operation times to the frame.
- The filmYour cut-ups read at the snap: alignment, personnel, who blocks whom.
Opponent game plans for college and NFL staffs
Every finding carries its count, its source and the exact question to take into the film room.
The season, live
Every drive of 2026, drawn as it happened.
Each streak is a real drive: where it started, how far it went and how it ended. Not a stock animation. The season itself.
Drawn from 13,425 real drives of the 2026 season, weeks 1–9: where they started, how far they went and how they ended.
- Touchdown
- Field goal try
- Punt
- Turnover or downs
Every snap of the season, counted.
- Plays
- 226,273
- Teams
- 298
- Players profiled
- 34,355
- Portal entries tracked
- 4,484
Our 2026 database: every game involving an FBS team through week 10, every FCS game through week 9 and every NFL game through week 8, every FBS, FCS and NFL team, and every 2026 transfer portal entry. Every opponent and every player is measured against the whole season, not a highlight reel.
The package
Open the game plan.
Five real pages from a full package, built from 2026 play-by-play. Team and player names are removed; every number is real.
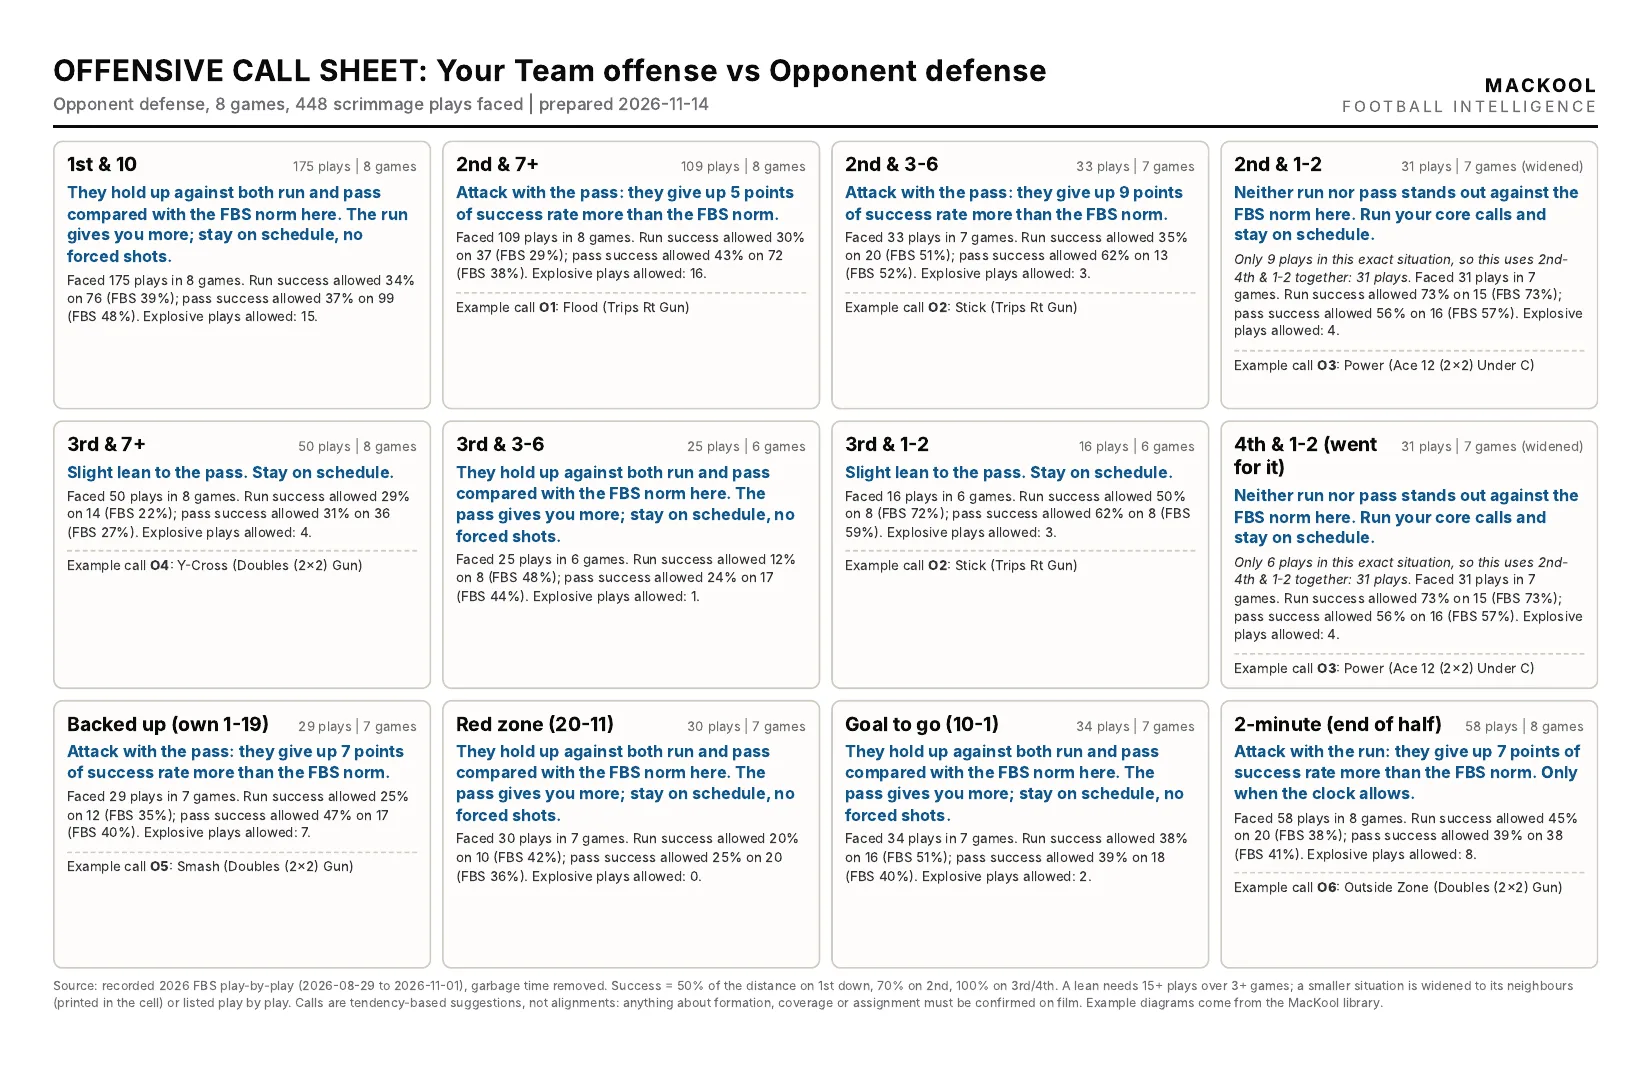
- 01Offensive call sheetHow to attack their defense in twelve situations, from 1st & 10 to the 2-minute drill, with the count behind every call.
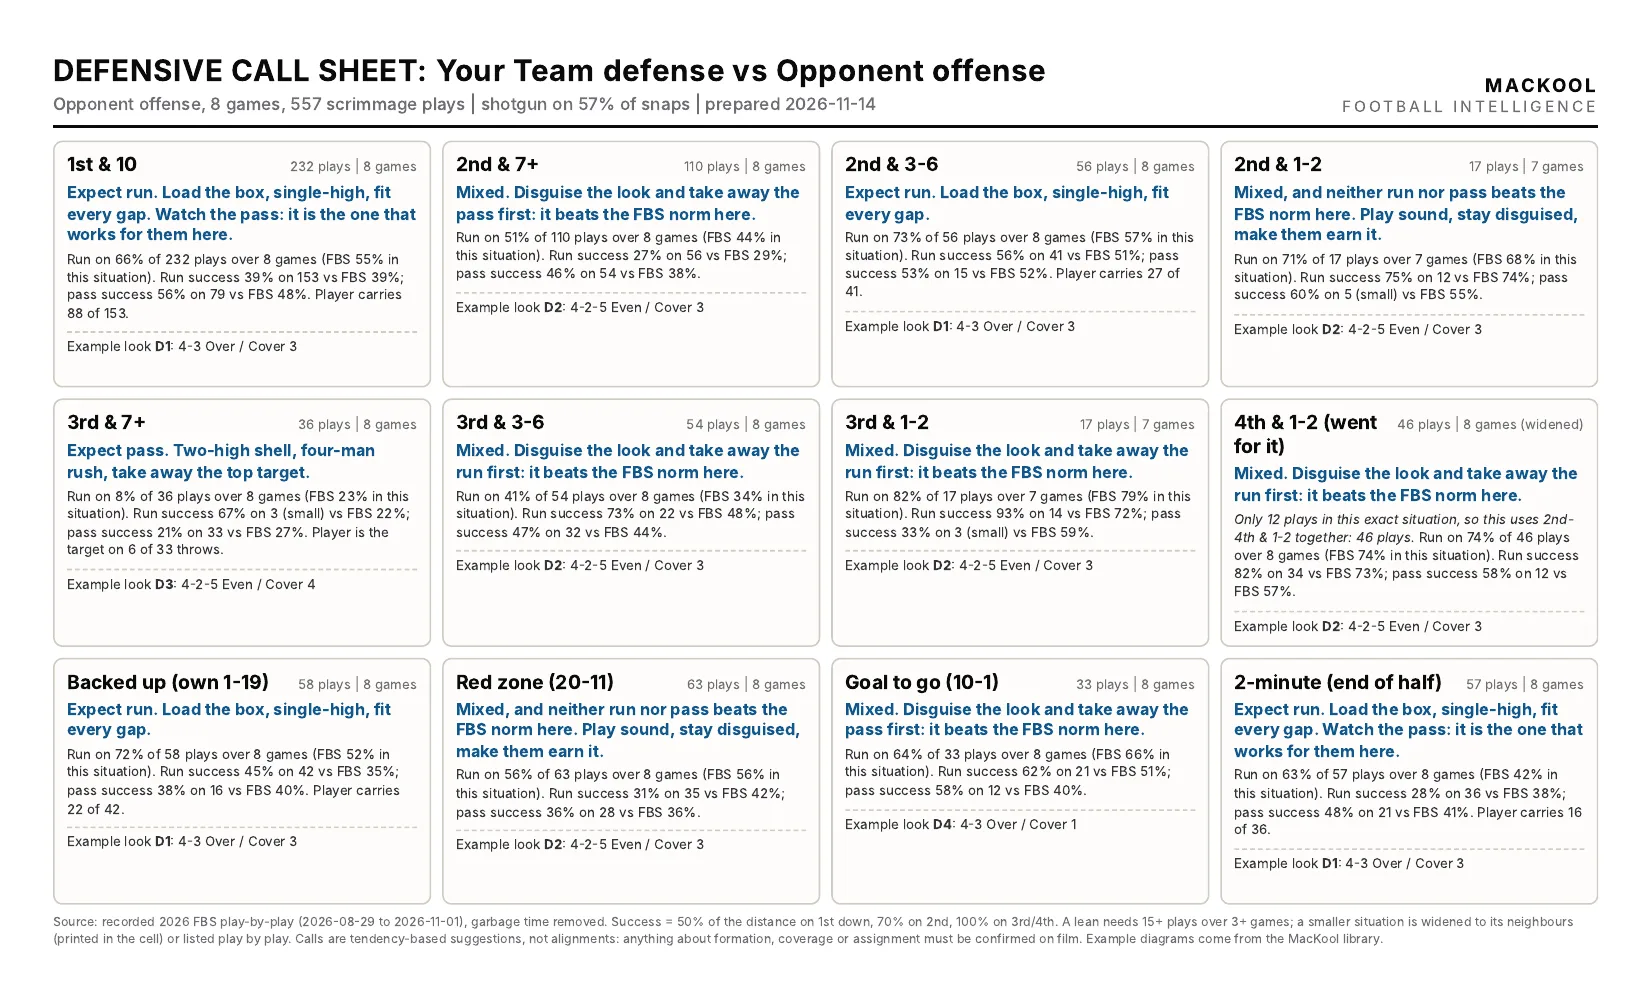
- 02Defensive call sheetWhat their offense does in each situation against the league norm, and the front and coverage it points to.
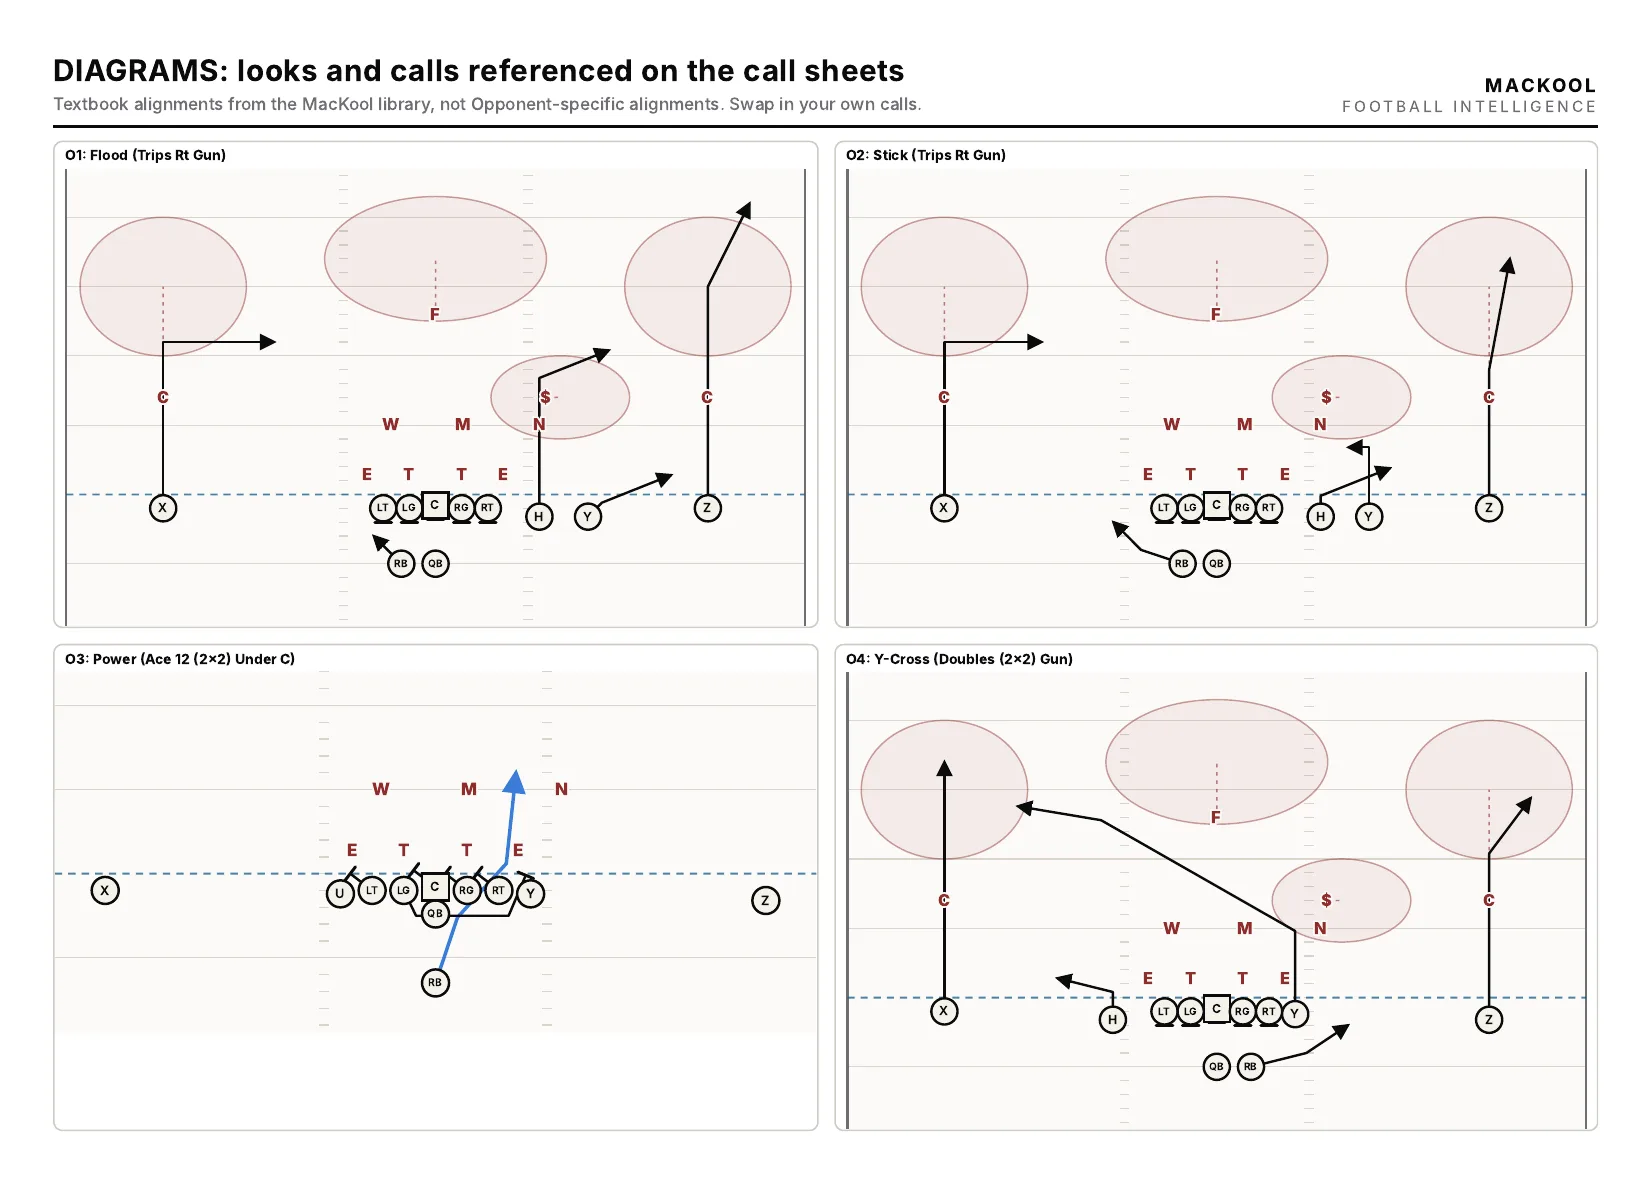
- 03The play sheetEvery suggested call drawn: routes, run paths and the coverage it is drawn against.
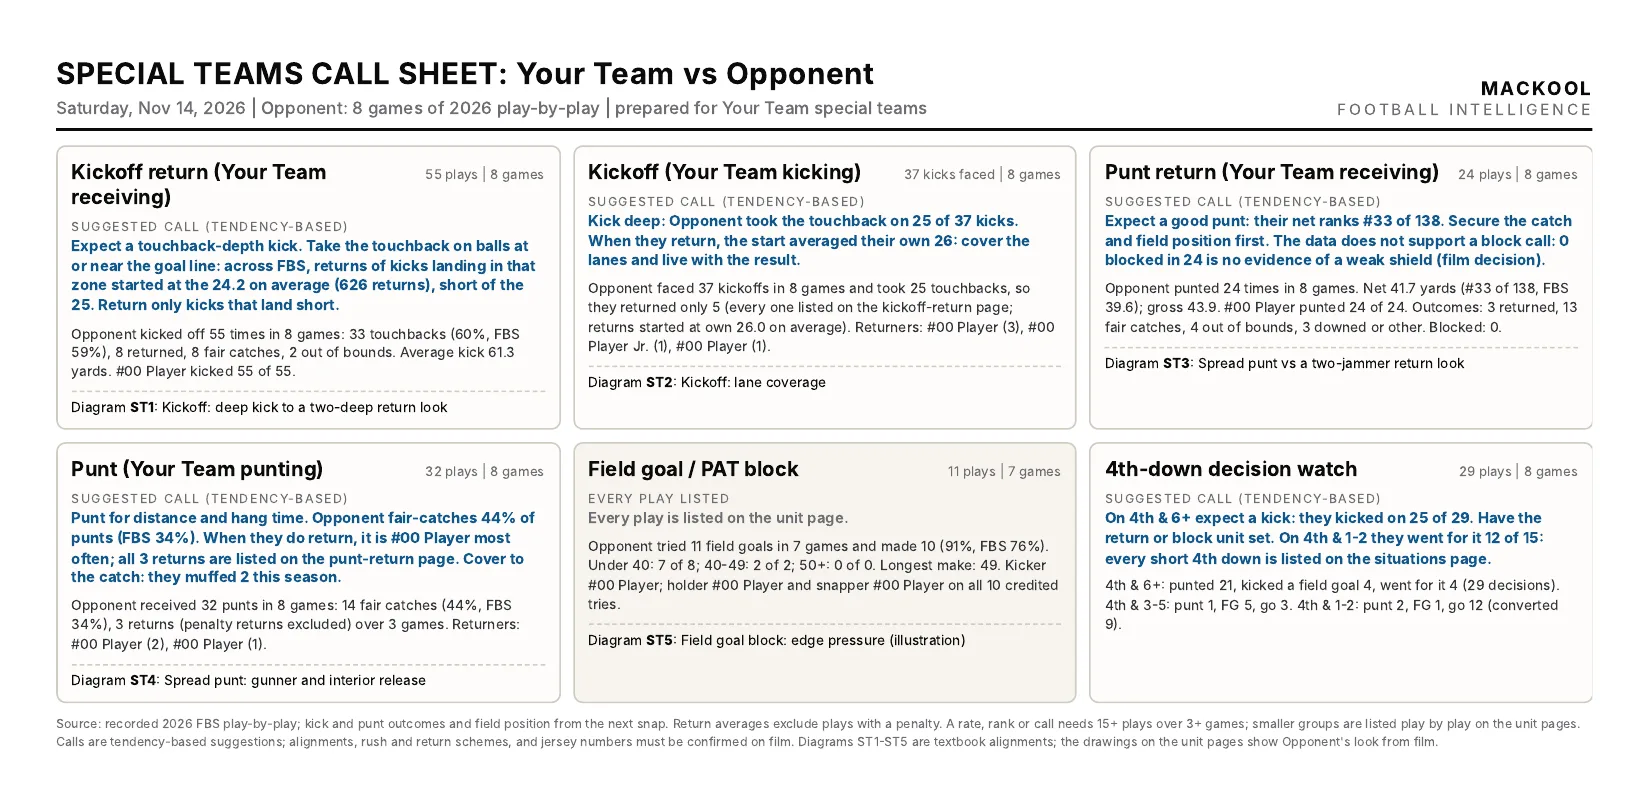
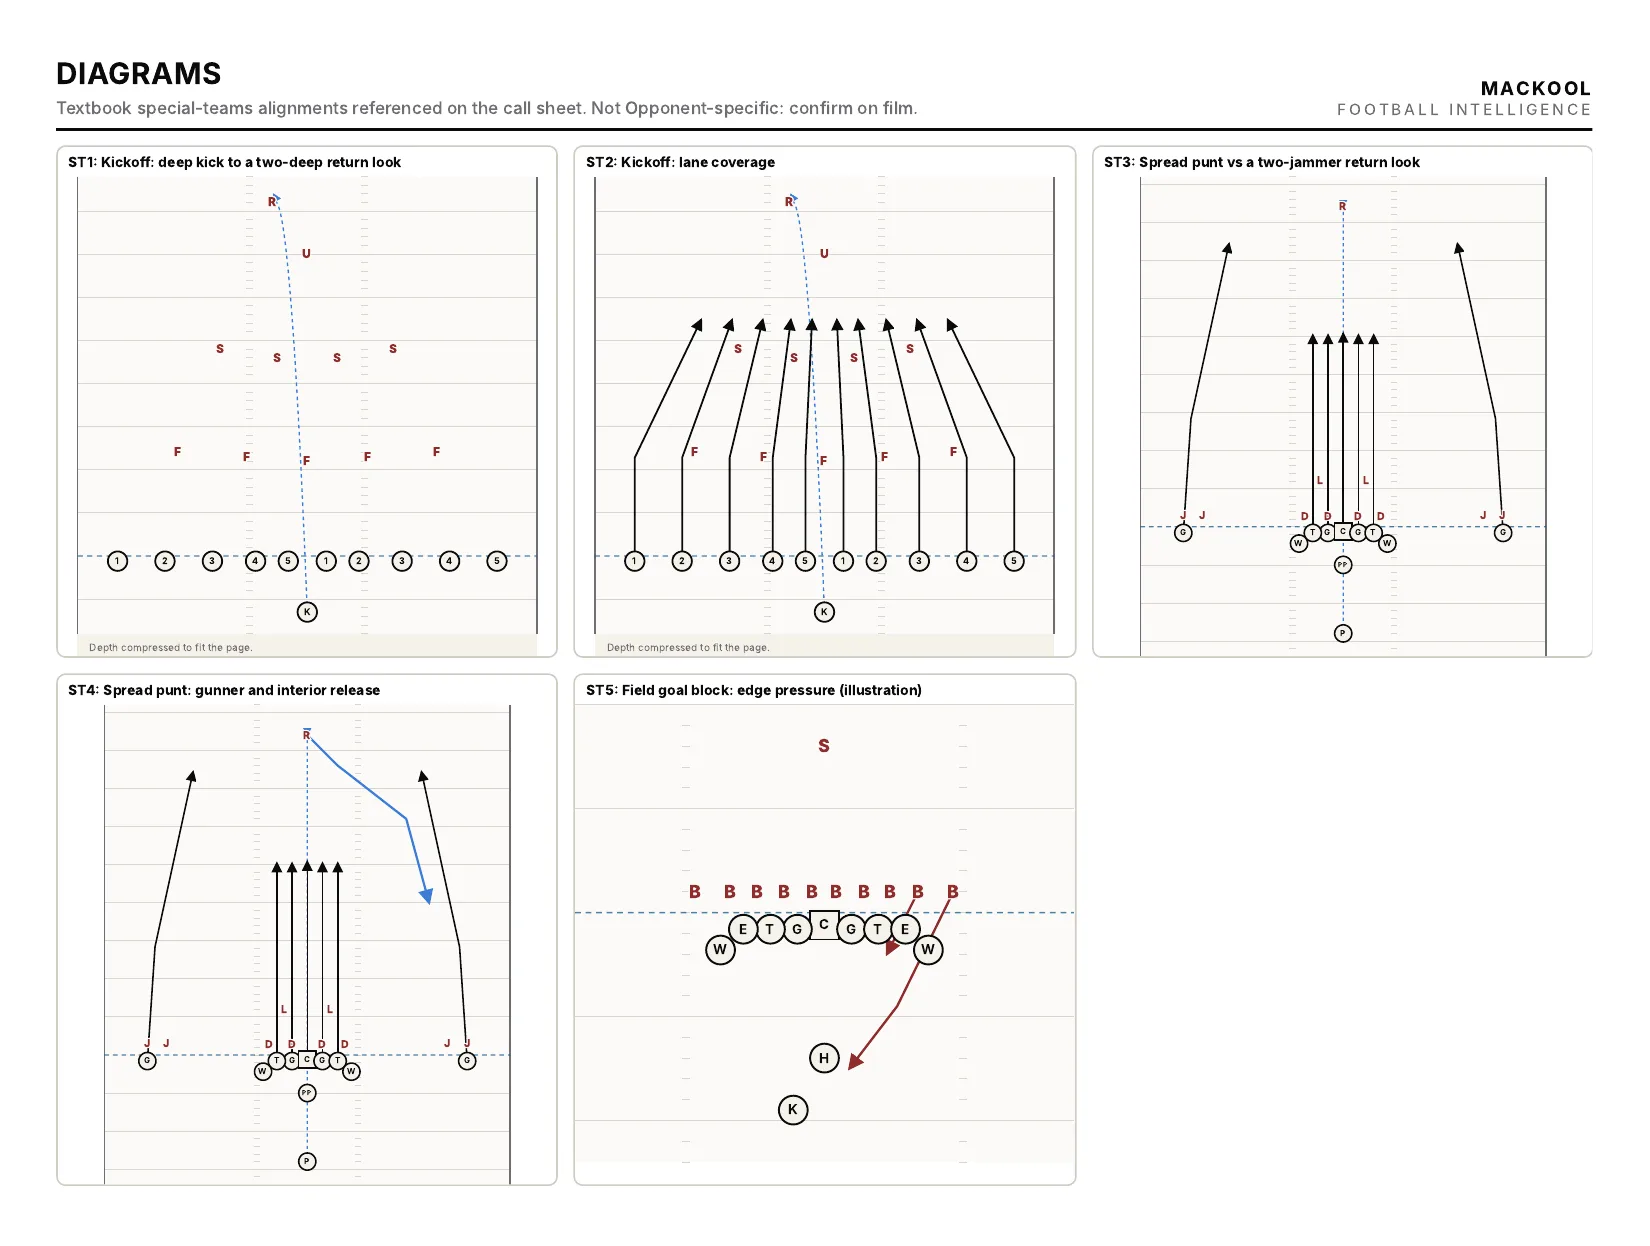
- 04Special-teams planKickoff, return, punt, punt return, field goals and fourth down: six units on one page.
- 05Special-teams diagramsThe opponent’s actual looks, drawn, with the call for each.
How a brief is built
The engine shows its work.
Every brief runs the same checks, in the same order, before a coach ever sees it. Sample sizes are tested, outliers and penalties are separated, and every claim is labelled by how sure we are.
If a number can’t pass, it doesn’t make page one.
- $ brief --opponent "Example Team" --through week-9
- › season database loaded110,694 plays · 622 games
- › opponent snaps isolated1,412 plays · 9 games
- › offense · 3rd-and-1–2 run 14 of 17, 7 gamesPASS n≥15
- › defense · red-zone TD allowed 5 of 9, 6 gamesALL 9 LISTED
- › special · KR start 22.0 vs touchback 25MODEL −0.15 pts
- › 2 returns with a penalty on the playlisted apart
- › film checklist11 questions · 46 plays
- › language check0 unlabelled claims
- ✓ coordinator summary ready page 1 of 14
The film room
AI that watches the film.
Send your cut-ups. The engine pulls frames at the snap from every angle, reads the alignment it can see, grades each read high, medium or low, and ties every clip to the official play. Your staff confirms anything a call depends on.
- $ film read --cutup punt-return --clip 14
- › frames at the snapend zone · sideline
- › players on the line7 HIGH
- › rushers after the snap6 MED
- › rush pathoutside, both sides MED
- › returners deep1 HIGH
- › jersey numbersLOW · confirm
- › matched to the official playquarter, clock, score
- › official resultpunt, fair catch
- ✓ added to season tendencies rates only at 15+ clips
- 01
Frames at the snap
Every clip is cut at the snap from the end-zone and sideline angles, where alignment can actually be read.
- 02
Every read graded
Fronts, rushers, rush paths, returners and kick types, each tagged high, medium or low confidence.
- 03
Tied to the official play
Each clip is matched to the official play by quarter, clock and score, so results come from the record, not the frame.
- 04
Into the game plan
Reads roll up into season tendencies, two seasons side by side, with the clips to watch numbered to your cut-ups.
- Clips charted in testing
- 539
- Seasons compared
- 2
- Clips matched to the official play automatically
- 86%
Film is used only for the program that sends it, and never shown on this site.
Player grades
Every player, graded against his position.
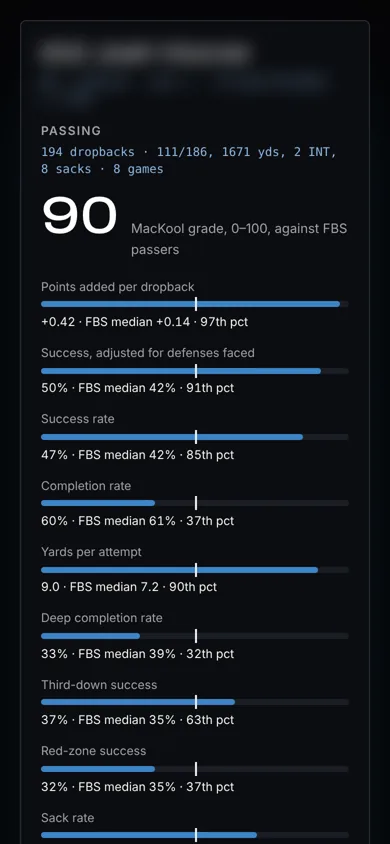
Each profile grades a player 0–100 against FBS, FCS or NFL players in the same role, adjusts his success for the defenses he faced, and writes out his strengths and weaknesses with the count behind every number. Behind the grade: season totals, splits by down, distance, field zone, half and score, and a game log. Small samples are pulled toward the median until they earn their place.
A real 2026 profile with the name and school removed. Client programs see every player by name in their portal.
The client portal
Look inside the portal.
Your staff logs in with a one-time code by email. Every FBS, FCS and NFL team in all twelve situations, every FBS, FCS and NFL player graded, and the transfer portal and recruiting boards, updated through the season.
- Team explorerEvery FBS, FCS and NFL team, twelve situations, against the league norm.
- Player profilesEvery player on every roster, graded 0–100 with totals, splits, a game log and strengths and weaknesses.
- MatchupYour offense against their defense in all twelve situations, open on your next opponent.
- ReportsEvery game plan delivered to your program, in one place.
- RecruitingThe transfer portal with new-school grades, and the high school class.
The live portal, recorded. Player names are blurred here; your staff sees everything.
The model
What field position is worth.
Every special-teams and fourth-down finding is priced in points by a drive-value model fitted on 12,660 drives from this season. A return to the 22 instead of a touchback at the 25 is no longer a feeling. It is a number.
is worth expected points
The rules we keep
A staff acts only on research it trusts. These hold every week, for every opponent.
Counts before percentages
A rate needs at least 15 plays across at least 3 games. Anything smaller is listed play by play, so nothing is hidden behind a percentage.
One long play is not a tendency
When a single play drives an average, we show the number without it, or drop the claim.
The film room stays yours
Formation, personnel, coverage and technique are confirmed on film, never guessed from a box score. Every finding lists its plays.
Permitted sources only
Every number traces back to a source whose terms allow our use, named in every report.
Built for the staffs who prepare on short weeks.
Your next opponent
See you on game day.
Name your next opponent and the questions your staff is asking. The plan reaches your coordinators before game week.
226,273 plays charted this season. Every team measured against its league.